hottest100
hottest100
![]()
![]()
The goal of hottest100 is to provide a compendium of Triple J hottest 100 songs. Data is scraped from Triple J’s best 100 Australian songs and historic information on Wikipedia.
There are three data sets on artists, tracks, and polls.
Installation
You can install the development version of hottest100 from GitHub with:
# install.packages("pak")
pak::pak("katerobsau/hottest100")
Data sets available
library(hottest100)
library(tibble)
library(dplyr)
#>
#> Attaching package: 'dplyr'
#> The following objects are masked from 'package:stats':
#>
#>     filter, lag
#> The following objects are masked from 'package:base':
#>
#>     intersect, setdiff, setequal, union
Tracks
Triple J Hottest 100 Track Data - A dataset containing track-level data from the Triple J Hottest 100. A data.frame with one row per track, including variables:
- alltime: Logical; indicates if the entry is from an all-time chart specific year.
- artist: Character; name of the artist or band associated withtrack.
- country: Character; the country associated with the track/chart.
- id: Unique identifier for each track (within year)
- pollyear: Countdown poll year
- position: Chart position of the track.
- track: Title of the track or song.
- releaseyear: Original release year of the track.
as_tibble(tracks)
#> # A tibble: 4,200 × 8
#>    alltime artist           country   id    pollyear position releaseyear track
#>    <lgl>   <chr>            <chr>     <chr>    <int>    <int> <chr>       <chr>
#>  1 FALSE   Spiderbait       Australia 1         1996        1 1996        Buy M…
#>  2 FALSE   Tool             USA       2         1996        2 1996        Stink…
#>  3 FALSE   Ben Folds Five   USA       3         1996        3 1996        Under…
#>  4 FALSE   Butthole Surfers USA       4         1996        4 1996        Pepper
#>  5 FALSE   Bush             UK        5         1996        5 1996        Glyce…
#>  6 FALSE   Powderfinger     Australia 6         1996        6 1996        Pick …
#>  7 FALSE   The Prodigy      UK        7         1996        7 1996        Breat…
#>  8 FALSE   Allen Ginsberg   USA       8         1996        8 1996        Balla…
#>  9 FALSE   Weezer           USA       9         1996        9 1996        El Sc…
#> 10 FALSE   311              USA       10        1996       11 1996        Down
#> # ℹ 4,190 more rows
# What are the top 1 tracks not incuding the "alltime" counts
tracks |>
 filter(
   position == 1,
   alltime == FALSE
 ) |>
 arrange(pollyear) |>
 select(
   pollyear,
   position,
   track,
   artist
 )
#>    pollyear position                                     track
#> 1      1993        1                                   Asshole
#> 2      1994        1                                    Zombie
#> 3      1995        1                                Wonderwall
#> 4      1996        1                             Buy Me a Pony
#> 5      1997        1                            No Aphrodisiac
#> 6      1998        1              Pretty Fly (For a White Guy)
#> 7      1999        1                                These Days
#> 8      2000        1                              My Happiness
#> 9      2001        1                                   Amazing
#> 10     2002        1                              No One Knows
#> 11     2003        1                 Are You Gonna Be My Girl?
#> 12     2004        1                               Take Me Out
#> 13     2005        1                             Wish You Well
#> 14     2006        1                          One Crowded Hour
#> 15     2007        1                        Knights of Cydonia
#> 16     2008        1                               Sex on Fire
#> 17     2009        1                           Little Lion Man
#> 18     2010        1                             Big Jet Plane
#> 19     2011        1 Somebody That I Used to Know {ft. Kimbra}
#> 20     2012        1                    Thrift Shop {ft. Wanz}
#> 21     2013        1                                   Riptide
#> 22     2014        1                             Talk Is Cheap
#> 23     2015        1                                     Hoops
#> 24     2016        1               Never Be Like You {Ft. Kai}
#> 25     2017        1                                   HUMBLE.
#> 26     2018        1                                Confidence
#> 27     2019        1                                   bad guy
#> 28     2020        1                                Heat Waves
#> 29     2021        1   Elephant [triple j Like A Version 2021]
#> 30     2022        1                               Say Nothing
#> 31     2023        1                        Paint The Town Red
#> 32     2024        1                          Good Luck, Babe!
#>                     artist
#> 1              Denis Leary
#> 2          The Cranberries
#> 3                    Oasis
#> 4               Spiderbait
#> 5             The Whitlams
#> 6            The Offspring
#> 7             Powderfinger
#> 8             Powderfinger
#> 9               Alex Lloyd
#> 10 Queens of the Stone Age
#> 11                     Jet
#> 12         Franz Ferdinand
#> 13         Bernard Fanning
#> 14             Augie March
#> 15                    Muse
#> 16           Kings of Leon
#> 17          Mumford & Sons
#> 18     Angus & Julia Stone
#> 19                   Gotye
#> 20 Macklemore & Ryan Lewis
#> 21               Vance Joy
#> 22              Chet Faker
#> 23              The Rubens
#> 24                   Flume
#> 25          Kendrick Lamar
#> 26             Ocean Alley
#> 27           Billie Eilish
#> 28           Glass Animals
#> 29             The Wiggles
#> 30       Flume [Ft. MAY-A]
#> 31                Doja Cat
#> 32           Chappell Roan
Polls
Triple J Hottest 100 Polls. A dataset with information about each Triple J Hottest 100 poll.
A data.frame with one row per countdown, including variables:
- year: The year the poll was held.
- alltime: Logical; whether the poll was an “All-Time” countdown
- alltimedescription: A description of the poll, if applicable.
- colorRGB: Primary RGB color value associated with the year in character format.
- contrastColorRGB: Contrasting RGB color value (in character format) suitable for text overlay.
as_tibble(polls)
#> # A tibble: 42 × 5
#>     year alltime alltimedescription    colorRGB      contrastColorRGB
#>    <int> <lgl>   <chr>                 <chr>         <chr>
#>  1  2025 TRUE    "Of Australian Songs" 224, 49, 37   <NA>
#>  2  2024 FALSE   ""                    119, 38, 127  <NA>
#>  3  2023 FALSE   ""                    221, 121, 62  0, 0, 0
#>  4  2023 TRUE    "Like A Version"      46, 65, 79    <NA>
#>  5  2022 FALSE   ""                    248, 215, 189 0, 0, 0
#>  6  2021 FALSE   ""                    0, 135, 0     <NA>
#>  7  2020 FALSE   ""                    239, 43, 204  0, 0, 0
#>  8  2020 TRUE    "Of The Decade"       16, 32, 92    <NA>
#>  9  2019 FALSE   ""                    244, 171, 68  0, 0, 0
#> 10  2018 FALSE   ""                    181, 204, 62  0, 0, 0
#> # ℹ 32 more rows
Artists
Triple J Hottest 100 Artists. A deduplicated dataset of artists
represented in the Triple J Hottest 100, created from tracks.
- artist: Artist name
- country: Country of origin
- releaseyear: Release year of included track
as_tibble(artists)
#> # A tibble: 2,729 × 3
#>    artist           country   releaseyear
#>    <chr>            <chr>     <chr>
#>  1 Spiderbait       Australia 1996
#>  2 Tool             USA       1996
#>  3 Ben Folds Five   USA       1996
#>  4 Butthole Surfers USA       1996
#>  5 Bush             UK        1996
#>  6 Powderfinger     Australia 1996
#>  7 The Prodigy      UK        1996
#>  8 Allen Ginsberg   USA       1996
#>  9 Weezer           USA       1996
#> 10 311              USA       1996
#> # ℹ 2,719 more rows
# who has appeared 10 or more times?
artists |>
 count(artist, sort = TRUE) |>
 filter(n >= 10)
#>                  artist  n
#> 1         Hilltop Hoods 14
#> 2          Foo Fighters 12
#> 3              The Cure 12
#> 4        The Living End 12
#> 5        Arctic Monkeys 11
#> 6             Radiohead 11
#> 7  Bring Me The Horizon 10
#> 8             Grinspoon 10
#> 9                  Illy 10
#> 10           Kanye West 10
#> 11            Metallica 10
#> 12            Pearl Jam 10
#> 13         Powderfinger 10
#> 14               R.E.M. 10
#> 15          Tame Impala 10
#> 16                   U2 10

# top 10 artists?
artists |>
 count(country, sort = TRUE) |>
 slice_max(n = 10, order_by = n)
#>        country    n
#> 1    Australia 1234
#> 2          USA  757
#> 3           UK  479
#> 4       Canada   48
#> 5  New Zealand   29
#> 6       Sweden   27
#> 7      Ireland   23
#> 8       France   18
#> 9      Germany   11
#> 10     Iceland   11
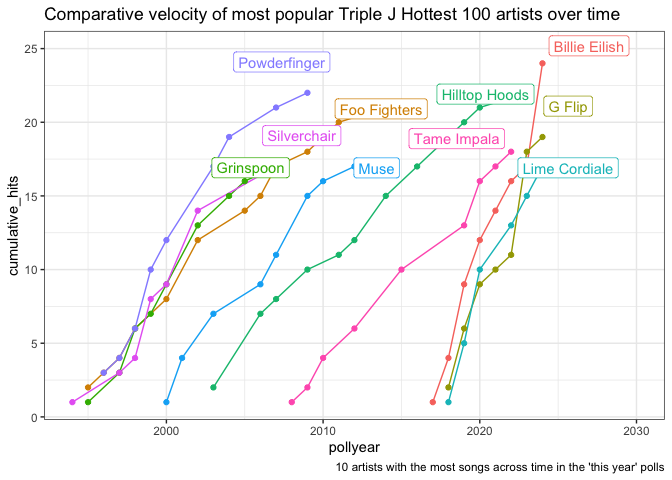
Old timers and newbies
The artists that are appearing frequently are an interesting mix of old timers and newbies. For the most common artists, have they had a long career, or did they rocket up the charts quickly?
library(ggplot2)
library(ggrepel)

tracks |>
  filter(!alltime )|>
  semi_join(
    # Filter to only the artists with the most appearances
    {tracks |>
      filter(!alltime ) |>
      group_by(artist) |>
      summarise(count = n()) |>
      ungroup() |>
      slice_max(count, n = 10)}
  ) |>
  group_by(artist, pollyear) |>
  summarise(hits = n()) |>
  ungroup() |>
  arrange(artist, pollyear) |>
  group_by(artist) |>
  mutate(cumulative_hits = cumsum(hits)) |>
  ungroup() |>
  group_by(artist) |>
  mutate(total_hits = sum(hits)) |>
  # Adding a filtered version of the artist's name for use in labelling the chart
  mutate(artist_name = ifelse(total_hits == cumulative_hits, artist, NA_character_)) |>
  # We'll use artist_name_y to offset the name positions a bit from the actual points so we can see both
  mutate(artist_name_y = ifelse(total_hits == cumulative_hits, cumulative_hits + 1, NA_integer_)) |>
  ungroup() |>
  ggplot(aes(x = pollyear, y = cumulative_hits, group = artist, col = artist)) +
  geom_line() +
  geom_point() +
  geom_label_repel(aes(y = artist_name_y, label = artist_name)) +
  theme_bw() +
  theme(legend.position = 'none') +
  scale_x_continuous(limits = c(NA, 2030)) +
  labs(title = "Comparative velocity of most popular Triple J Hottest 100 artists over time",
       caption = "10 artists with the most songs across time in the 'this year' polls")
#> Joining with `by = join_by(artist)`
#> `summarise()` has grouped output by 'artist'. You can override using the
#> `.groups` argument.
#> Warning: Removed 77 rows containing missing values or values outside the scale range
#> (`geom_label_repel()`).